

Most advertisers spend hours obsessing over ad creative, keyword bids, and audience targeting, then send those hard-earned clicks to a landing page that was never designed to convert. The traffic arrives, looks around for a few seconds, and leaves. The budget keeps running. The results stay flat. If you want to increase landing page conversions, the page itself is where the work starts, not the ad.
The gap between average and excellent tells the real story. In 2026, the all-industry median conversion rate sits around 6.6%, but ecommerce landing pages average just 4.2% while top performers regularly clear 10% or more. That gap is not about ad spend, it is about what happens after the click. At EcomTalkPoint, the team sees this pattern constantly across client accounts: the same ad budget producing wildly different returns depending on what the traffic lands on. Great ads deserve a great page.
This article covers 16 specific conversion rate optimization tactics split into quick wins and longer-term plays, a simple A/B testing roadmap you can start this week, and the KPIs that actually tell you whether the work is paying off.
Why your landing page is costing you more than a bad ad ever could
Conversion benchmarks that show where you actually stand
Before you change anything, you need an honest read on where your page sits. Here are the 2026 industry benchmark medians, drawn from published CRO benchmark reports:
| Industry | Median conversion rate |
|---|---|
| Entertainment and events | 12.3% |
| Education | 8.4% |
| Financial services and insurance | 8.3% |
| Legal services | 6.3% |
| Healthcare and wellness | 5.1% |
| Ecommerce | 4.2% |
| SaaS and technology | 3.8% |
These numbers only mean something compared against the right context. Your benchmark needs to match your traffic source, device mix, and conversion action type. An email opt-in, a demo request, and a completed purchase should never share the same target rate. As a practical interpretation framework: below 2% usually signals something structurally broken, 5, 10% is strong for most lead-gen pages, and 10% or above is excellent.
What heatmap analysis reveals that analytics can’t
Google Analytics tells you that visitors left. Heatmap tools like Microsoft Clarity or Hotjar show you why they left, where users actually click, how far they scroll, and where they drop off, often exposing problems that standard metrics completely hide.
Heatmaps consistently surface the same recurring problems: users clicking on non-clickable elements (meaning they expect interactivity that isn’t there), rage clicks on forms indicating frustration with validation errors or confusing fields, and scroll depth showing that most visitors never reach your CTA. Treat heatmap analysis as the mandatory first diagnostic step before touching anything on the page. It generates the hypotheses you’ll later confirm through A/B testing. Skipping it means guessing at problems instead of solving them.
How to increase landing page conversions: 8 quick wins this week
Cut your form down to what’s actually necessary
Reducing form fields from 11 to 4 has produced conversion lifts as high as 120% in individual documented case studies, though typical relative lifts across tests more commonly fall in the 10, 40% range. Even trimming from 4 fields to 3 has shown a 50% lift in some tests. The logic is simple: every field you ask for is a question the visitor must answer, and each one introduces a reason to stop and reconsider.
For most lead-gen pages, ask for name, email, and one qualifying field at most. For ecommerce, single-page guest checkout often outperforms multi-step flows in published tests, though the right answer depends on your audience, so A/B test before committing. Reducing form friction is consistently one of the highest-ROI changes you can make to a lead-gen page with minimal design work.
Rewrite your CTA copy and move it where it belongs
Generic labels like “Submit” or “Learn More” do not communicate an outcome. First-person CTA copy, “Get my free audit” rather than “Get your free audit”, outperforms generic labels by 21, 28% in documented tests, and some first-person versus second-person A/B tests have shown a 90% CTR improvement. A single, visually dominant CTA outperforms pages with three or more competing buttons by around 37%.
One more move that consistently works: add friction-reducing microcopy directly under the button. A short line like “No credit card required” addresses the visitor’s hesitation at the exact moment they’re deciding whether to act. Short copy, real impact.
Add social proof that a skeptic would believe
Generic praise does nothing. Specific testimonials, a named customer, a measurable result, and relevant context, drive roughly 30%+ conversion lifts compared to pages with no testimonials, based on published split tests. Client logos add credibility, but only when the brands shown are recognizable to your specific audience and genuinely associated with the offer.
Video testimonials outperform written text by 80, 86% as a relative gain in some documented studies, because they carry emotional credibility that text alone cannot replicate. If you have one strong video testimonial from a real customer with a specific outcome, place it above the fold near your primary CTA. That position, near the point of highest hesitation, is where proof does its best work.
CRO tactics that build conversion rate gains over time
Page load speed is a conversion variable, not a technical checkbox
Pages loading in 1 second convert at roughly 3 times the rate of pages loading in 5 seconds, according to Portent’s dataset. A 1-second improvement correlates with a 2, 7% relative conversion lift. The biggest gains come from bringing slow loads down from 4, 5 seconds to 2, 3 seconds. Improvements below 1.5 seconds start producing diminishing returns.
Start with image compression, eliminating render-blocking scripts, and switching to a CDN, these changes cost nothing except time and typically deliver the largest speed improvements on most landing pages. Run your page through Google’s PageSpeed Insights before and after to confirm the gains.
Personalize the page by traffic source
A visitor arriving from a branded Google Search ad already knows your brand and is likely in a decision-making mindset. A visitor from a cold Meta prospecting campaign does not know you and needs the page to recreate the emotional continuity of the ad they just clicked. Sending both visitors to the same page is a significant missed opportunity.
Dynamic text replacement and source-specific landing page variants let you match the message, tone, and offer to where the visitor came from. For Google Search traffic, mirror the search query in your headline. For Meta cold traffic, lead with the benefit or hook from your ad creative. Message match between the ad and the landing page headline is one of the highest-leverage levers available for paid traffic. When the headline echoes the ad promise, friction drops immediately and bounce rates follow.
Mobile optimization for paid traffic specifically
A significant portion of paid traffic clicks happen on mobile, yet many landing pages are still designed desktop-first. Forms with six or more fields, small tap targets, and slow mobile load speeds all suppress conversion rates in ways that desktop testing will never reveal.
Always test the mobile experience separately from desktop in your analytics. Conversion rates often differ substantially by device, differences of tens of percent are common, and when your mobile CVR runs significantly lower than desktop, that is not a data anomaly. It is a UX problem waiting to be diagnosed and fixed. Segment the data, identify where mobile users drop off, and treat it as a separate optimization track.
How to run a simple landing page A/B test without guessing
What to test first and in what order
Not all variables produce equal impact. Follow this priority sequence: headline first (the single biggest lever for first impressions), then CTA copy and placement, then form length, then hero image or video, and finally social proof format. This order reflects where most visitor decisions are actually made.
Run one variable change at a time. Testing the headline and the CTA simultaneously makes it impossible to isolate which change drove the result. Use a tool like VWO, Unbounce’s built-in testing, or Google’s current A/B testing solutions to split traffic evenly between variants. Keep the test running until you have enough data to trust the result.
How to read results without fooling yourself
A test needs enough traffic to reach statistical significance, typically at 95% confidence. For most small-to-mid advertisers, that means running the test long enough to cover at least two complete business cycles, commonly two full weeks, and hitting your planned sample size. Aim for roughly 100, 200 conversions per variant, not just visitors. At a 3% conversion rate, that means approximately 3,300 to 6,700 visitors per variant. Track actual conversions as your primary success metric, not clicks or bounce rate.
When a test produces a clear winner, document the result and immediately set up the next test. Landing page optimization is a perpetual cadence, not a one-time project. The brands that win at paid advertising are the ones running their tenth test while their competitors are still setting up their first.
The compounding effect when strong ad management meets a high-converting page
Why most advertisers optimize one side and ignore the other
Most paid advertisers improve their ads or their landing page, rarely both simultaneously. The math of combining both improvements is multiplicative, not additive. If your ad CTR improves by 20% and your landing page CVR improves by 25%, total conversions from the same budget increase by roughly 50% (1.20 × 1.25 = 1.50). Each side amplifies the other.
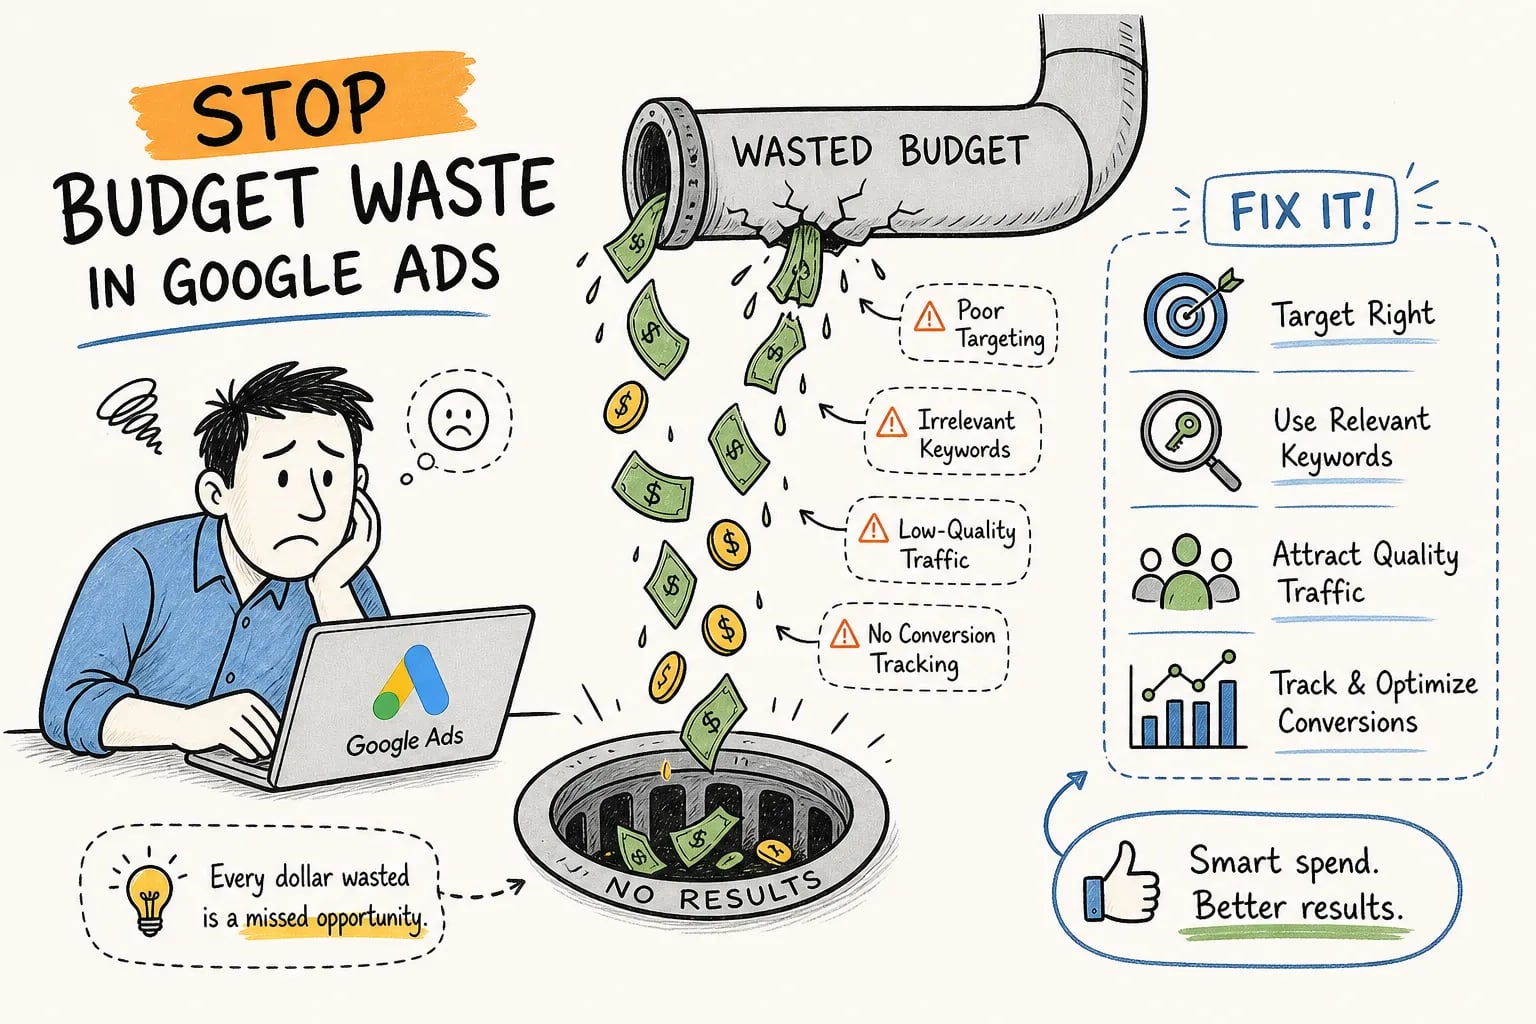
Wasted ad spend does not only come from bad targeting or weak bids. It also comes from sending well-targeted clicks to a page that was not built to close. Every dollar spent driving traffic to a low-converting page is a dollar compounding in the wrong direction. Fixing the page is not a secondary task, it is core campaign management.
How EcomTalkPoint builds this into every campaign
EcomTalkPoint treats landing page optimization as an integrated part of campaign management, not an afterthought. The team reviews conversion data, identifies page-level friction, and works alongside clients to improve CVR while simultaneously tightening ad targeting and bidding strategy. This dual-focus approach is what separates profitable campaigns from ones that simply look active in the dashboard.
Lower cost per click combined with a higher conversion rate equals a lower cost per acquisition across every channel. For ecommerce brands and service businesses running Google Ads or Meta Ads, that combination is where real margin improvements happen. If you want both sides handled by a team built for exactly that, EcomTalkPoint’s landing page optimization and PPC management work is the place to start. Reach out to begin with an audit.
KPIs to track so you know your CRO work is actually paying off
The metrics that matter by traffic source
Track conversion rate segmented by traffic source, never as a blended average. Your Google Search CVR and your Meta cold traffic CVR will differ significantly, and blending them hides problems that require different solutions. Also monitor cost per conversion over time, not just conversion rate. CVR can stay flat while cost per conversion improves if your CPC drops through a better quality score. Form completion rate, measured as forms started versus forms submitted, pinpoints exactly where friction is highest in your current form flow.
Signals that tell you it’s working
A page speed score improvement followed by a conversion rate lift confirms a speed-related bottleneck was real. Scroll depth increasing after a page redesign means visitors are engaging with more content before they decide. These are directional indicators that your changes are solving actual problems.
ROAS improvement measured over an appropriate post-change period, commonly 30, 60 days, controlled against ad spend and seasonality, is the clearest signal that landing page work is translating into campaign profitability. That is the metric that ultimately justifies the investment and makes the business case for the next round of optimization.
Start with the page, not just the ad
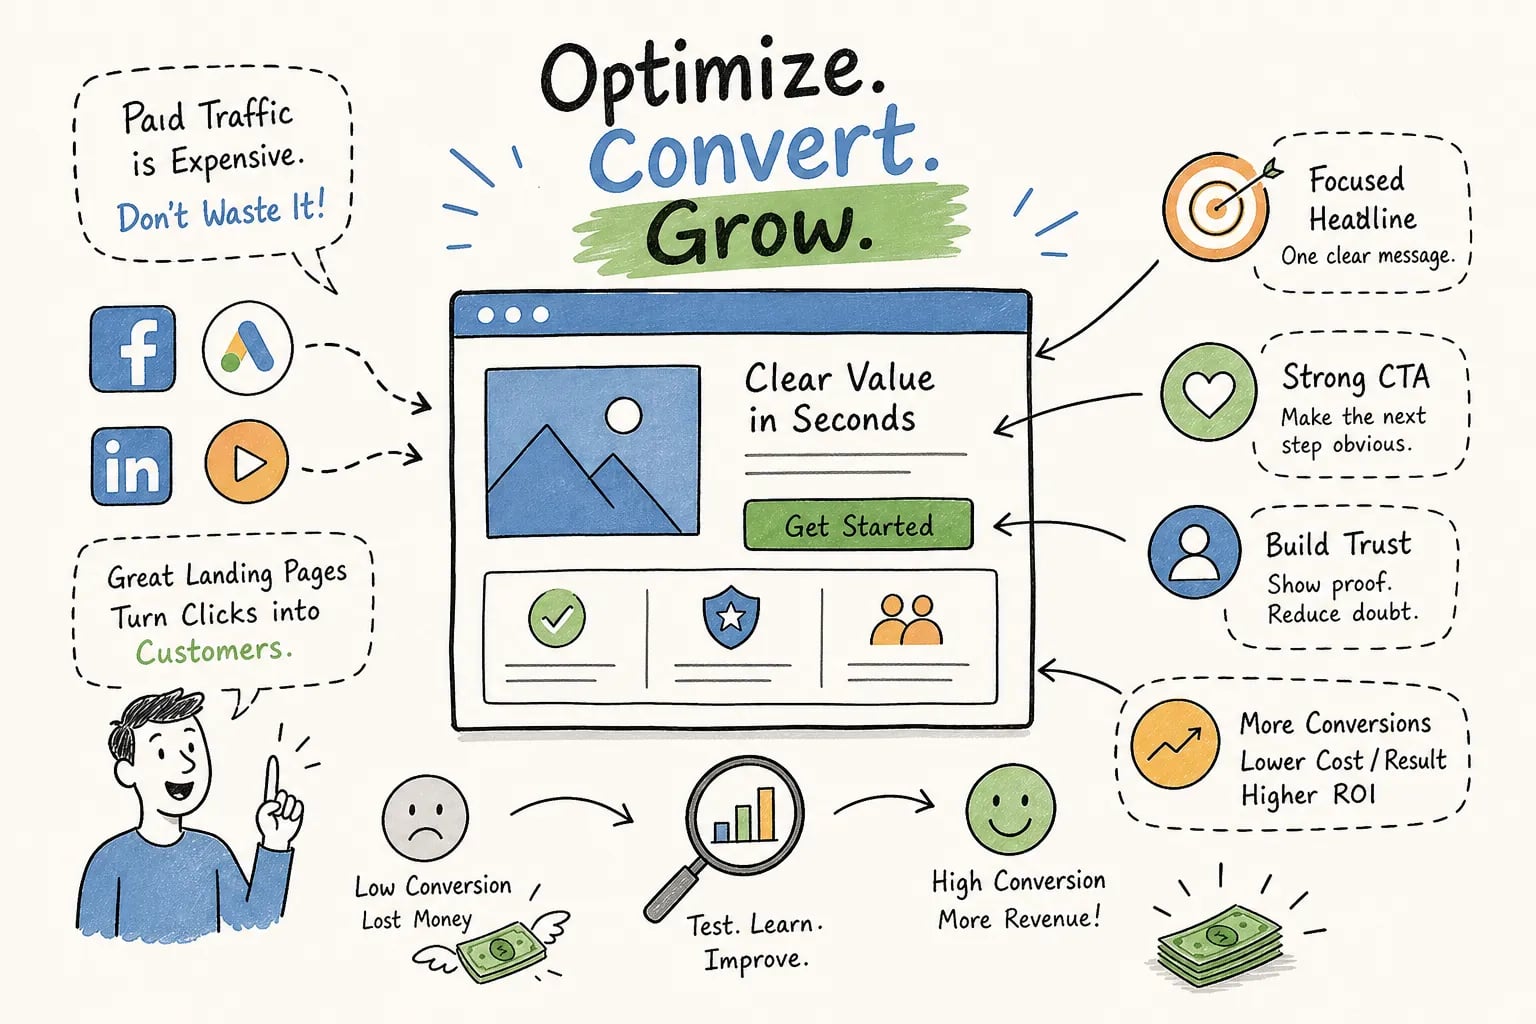
The goal when you increase landing page conversions is not to make the page look better, it is to remove friction and build trust at each step. The visual design matters far less than whether the visitor immediately understands what you’re offering, believes you can deliver it, and faces no unnecessary obstacles in saying yes.
Start with heatmap analysis to diagnose the real problems. Then tackle the quick wins: shorten the form, sharpen the CTA, and add specific social proof. From there, build the A/B testing cadence that compounds gains over time. The most profitable paid advertising campaigns in 2026 are run by teams that optimize both the ads and the pages they lead to. Neither side alone gets you there.
If you want a partner who handles both sides of that equation, get in touch with the EcomTalkPoint team. The work starts with understanding what is currently broken, then fixing it in a structured, measurable way. Want a free audit to increase landing page conversions on your best-performing campaigns? That’s exactly where EcomTalkPoint starts.